
Section 3
General Waste Reduction Practices
3.1 INTRODUCTION
Section 3 covers general waste reduction practices. The implementation of these practices is considered the first step in an effective pollution control program. These methods are relatively inexpensive to implement and they reduce the need for more expensive recovery, recycle and treatment technologies. The effective implementation of waste reduction practices requires an organized and efficient approach; otherwise, the effects will be isolated within the shop and will have little impact on overall recovery or compliance goals. Within the past fifteen years, a significant effort has been made by EPA and industry to establish guidelines for the effective implementation of waste reduction practices. Some key elements of those guidelines are presented in Section 3.2. A large number of potential waste reduction practices have been identified from the literature search. These practices, which have been categorized into three groups, are reviewed in Sections 3.3, 3.4 and 3.5 and summary tables are presented at the end of this section. The three groups of waste reduction practices are:
- Good Operating Practices
- DragOut Loss Reduction
- Rinse Water Reduction
3.2 POLLUTION PREVENTION AND SOURCE CONTROL
Various terms are used to group or categorize the different methods employed by industry in their pollution control strategies, e.g., pollution prevention, source control, waste minimization, and in-plant changes. One popular term used extensively by EPA is pollution prevention.
This term (see definition in Section 3.2.1) covers a broader range of pollution control methods than is presented in Section 3. Other aspects of pollution prevention such as chemical recovery, bath maintenance and process chemistry changes are covered in Sections 4 through 6. Pollution prevention is a concept that includes not only the technical methods for reducing waste generation, but also the organizational and administrative tools for implementation. To familiarize the reader with the pollution prevention approach, key aspects of this concept are presented in the following subsections.
 |
 |
 |
3.2.1 Definitions
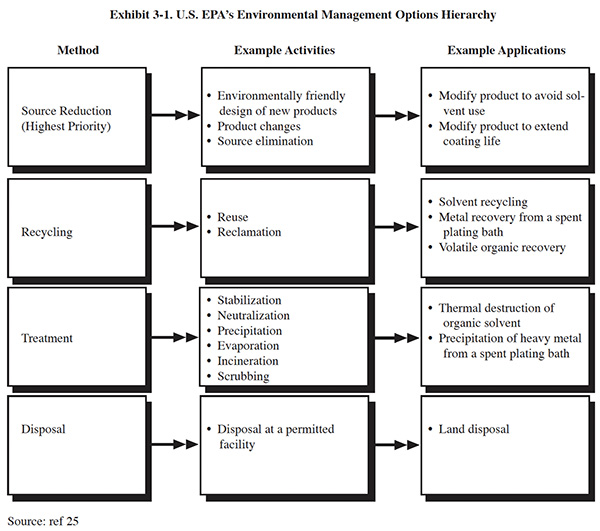
Pollution prevention, as defined by EPA, is the maximum feasible reduction of all wastes (wastewater, solid waste and air emissions) generated at production sites. It involves the judicious use of resources through source reduction, energy efficiency, reuse of input materials during production and reduced water consumption. Source reduction is the highest priority in the U.S. EPA's Environmental Management Options Hierarchy (Exhibit 3-1). It is defined as the use of materials, processes, or practices that reduce or eliminate the creation of pollutants or wastes at the source (ref. 26, 302).
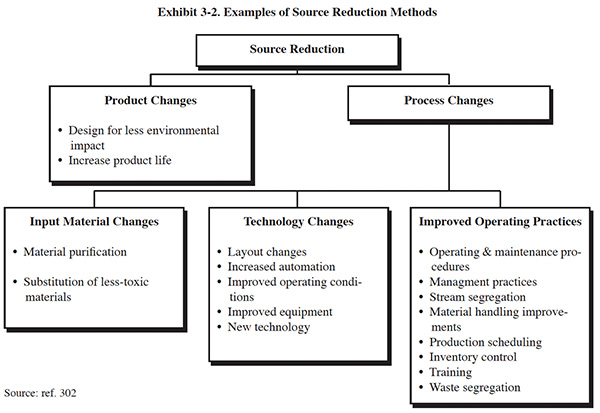
There are two general methods of source reduction that can be used in a pollution prevention program: product changes and process changes. Product changes are changes in the composition or use of the intermediate or end products that are performed by the manufacturer with the purpose of reducing waste from manufacture, use, or ultimate disposal of the products. This method of pollution prevention is addressed in Section 6. Process changes are manufacturing modifications that impact how the product is produced. These methods of pollution prevention are discussed in this section and in Section 6. Process changes include: input material changes, technology changes and improved operating practices. Typically, improved operating practices can be implemented more quickly and at less expense than input material and technology changes. Examples of these source reduction options are shown in Exhibit 3-2.
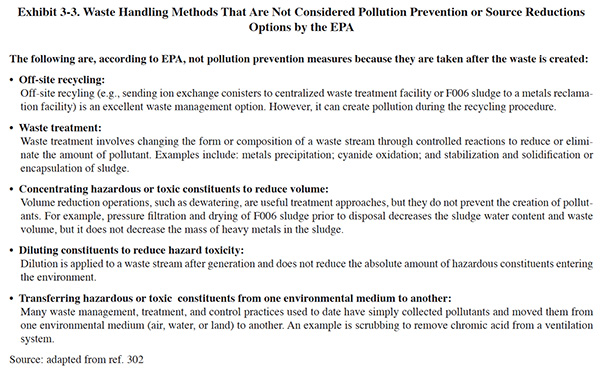
There are a number of pollution control measures that are applied only after wastes are generated. They are, therefore, not correctly categorized as pollution prevention. Exhibit 3-3 provides some examples of procedures that are waste handling, not source reduction measures. Because these procedures are classified as waste handling, their implementation may not provide pollution prevention credits under certain state or Federal statutes.
However, their implementation may be beneficial both in terms of environmental protection and cost reduction and therefore should not be overlooked.
Facilities are required to have pollution prevention programs for wastes classified as hazardous. The applicable Federal regulations include:
- The Resource Conservation and Recovery Act (RCRA) requires that facilities with permits for treatment, storage, or disposal implement a program to reduce the volume or quantity and toxicity of these wastes.
- The Pollution Prevention Act (PPA), specifies that facilities required to report releases to the U.S. EPA for the Toxic Release Inventory (TRI)provide documentation of their procedures for preventing the release of these materials or for reusing these materials. The PPA encourages that the preferred method of preventing pollution is to reduce the volume of waste generated at the source and to perform reuse (closed-loop recycling) whenever possible.
- The Comprehensive Environmental Response, Compensation, and Liability Act (CERCLA), requires generators of hazardous waste to evaluate and document their operations.
 |
 |
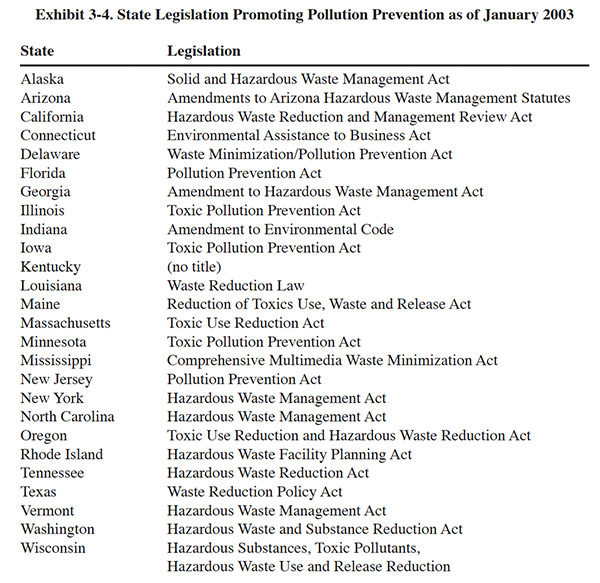
In addition to Federal regulations covering this topic, many states have enacted legislation that requires pollution prevention. As of January 2003, a total of 26 states had passed such legislation. These states are listed in Exhibit 3-4.
Source reduction methods have been well documented and utilized within the metal finishing industry for more than 20
years to: (1) reduce input material use, waste generation, energy use, and production costs; (2) minimize worker
exposure to hazardous chemicals; and (3) improve product quality (ref. 1).
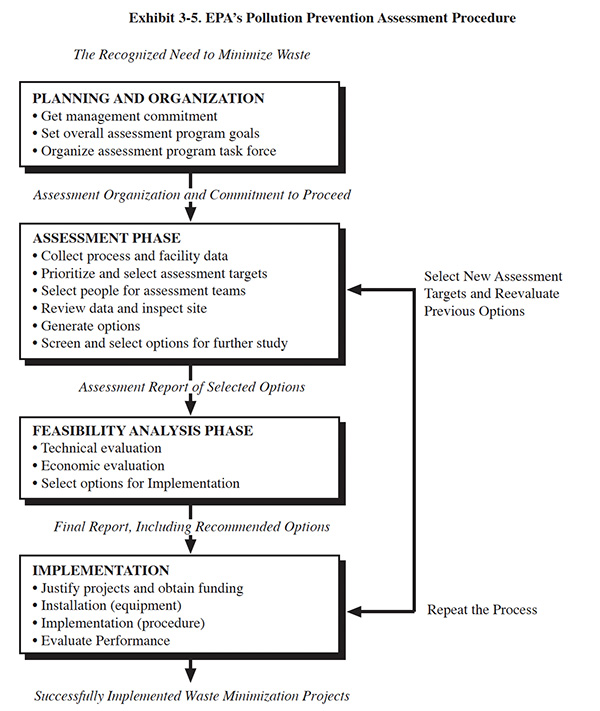
EPA has developed a systematic procedure for identifying, evaluating and implementing source reduction and other
pollution control methods (Exhibit 3-5), which is termed the Pollution Prevention Assessment Procedure. Published
materials are available that specifically relate this methodology to the metal finishing industry (ref. 25, 378).
3.2.2 Pollution Prevention Programs
This section presents an approach for establishing a pollution prevention program and initiating the assessment and implementation of pollution prevention measures. The overall approach includes an organizational frame-work needed for creating a pollution prevention program, guidelines for pollution prevention planning and goal setting, procedures for collecting and organizing information and data, techniques for evaluating and ranking pollution prevention options and methods for implementing, monitoring and assessing program elements.
Portions of the approach are extracted from EPA's waste minimization strategy (ref. 26), which is presented in Exhibit 3-5. Also included are successful elements of existing corporate pollution prevention programs and field proven techniques which have been identified from the NCMS Survey.
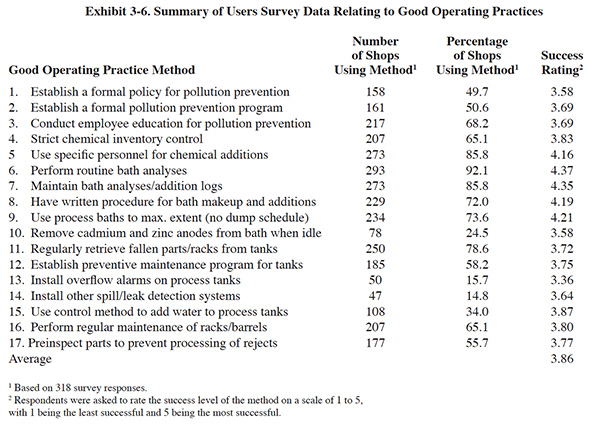
The User Survey (see description in Section 2), asked platers if their shops had established a formal pollution prevention program. A summary of responses to this question and others relating to pollution prevention programs and good operating practices is presented in Exhibit 3-6. Of the 318 plating shops responding to the survey, 161 (or 50.6%) indicated that they have established a formal pollution prevention program. The average success rating given by respondents for this pollution prevention method was 3.69. This rating is slightly lower than the average rating for all good operating practices. It should be noted that, although its rating is below the average for all methods, it still received a rating in the upper one-half of the rating scale (see description of rating scale on Exhibit 3-6), as did all of the methods.
3.2.2.1 Pollution Program Organization
The regulations and incentives which create a need for pollution prevention were identified in Section 3.2.1. To meet these needs effectively, small companies, corporations and Federal facilities must initially develop a well defined pollution prevention policy and establish a pollution prevention organization or task force with the committed fiscal and administrative authority. Without top management support and a well defined organization with functional and financial capabilities, a pollution prevention program will be short lived and will not have a substantial impact on waste generation. Some guidelines for pollution prevention policy development and task force organization are presented in the following subsections.
3.2.2.2 Pollution Prevention Policy
A pollution prevention policy is a statement which reflects the general goals of the program. The following example is a pollution prevention mission statement used by a major aerospace corporation (Source: confidential contribution).
"Our goal is to implement an effective pollution prevention program to eliminate liquid, solid and gaseous waste generation. Program priorities shall emphasize the protection of employees, community and the environment while maintaining product quality and business objectives."
Both the pollution prevention policy and the task force should be established in a manner that cuts across the entire organization, involving all employees and especially the workers with direct contact with waste generation. Pollution prevention will not be effectively achieved without the acceptance and cooperation of the operators. Often, operators cause waste and they are in the best position to prevent it.
Policy statements can be written to communicate clearly that pollution prevention is an important measure of employee performance, like production yield and quality. Waste generation tracking should be instituted at the most basic level possible to provide quantitative measures of performance.
Of the 318 plating shops responding to the Users Survey, 158 (or 49.7%) indicated that they have established a formal policy statement with regard to pollution prevention and control. The average success rating given by the respondents for this pollution prevention tool was 3.58 (see Exhibit 3-6).
 |
 |
3.2.2.3 Task Force Organization
The size of the program task force will depend heavily on the size of the company. At a minimum, the task force should include members of any group or department in the company that manages, generates, handles or in some other manner affects wastes. Some members, who work directly with waste generation, may be constantly involved in the program while others, who have less direct contact with the waste generating processes, may only attend major planning meetings. Potential departments and personnel that would be appropriately involved from a major manufacturing company include (ref. 26):
- Plant vice president
- Metal finishing department manager
- Process engineer responsible for the operation of metal finishing processes
- Facilities engineer responsible for the maintennance of metal finishing equipment
- Wastewater treatment department supervisor
- Staff environmental engineer
- Hazardous waste coordinator
Larger companies, with successful programs, typically have 10 to 20 people on the task force. Some small companies have successful programs with as few as 2 to 4 members. In any case, a single person should not be given the sole responsibility for the program. This will isolate the program from the employees and generate a narrow range of ideas.
The organization of the task force may be dictated by a company's structure. As with any group, a leader is needed to chair meetings, motivate members and maintain communications. In large companies, the leader typically comes from the environmental department. The leader should be an experienced individual with knowledge of both environmental and production issues. Besides a task force leader, the organizational structure may consist of committees, headed by committee leaders, with well defined responsibilities. These committees could be organized by production areas, specific pollution prevention projects or task force responsibilities such as data collection. Typically, the organization structure and size will change as the program matures through the assessment phases and into implementation. The scope of the program will determine whether full-time participation is required by the leader or other team members (ref. 26, 303).
Employees can become involved in the program through working groups and motivated with financial incentive programs. Larger companies with Total Quality Management can utilize this organizational structure to encourage the generation of pollution prevention ideas.
The Users Survey requested shops to provide information about categories of employees and technical resources available at their sites. Their responses provide some insight to the types of personnel that are available to participate on a task force. A partial summary of these data is shown in Exhibit 3-7. Additional data identifying labor categories (e.g., process engineers, chemists, skilled trades, etc.) employed by the survey respondents is contained in the database.
3.2.2.4 Pollution Prevention Goals
The first priority of the task force should be to establish goals that are consistent with the policy adopted by management (ref. 26). The general policy of the program establishes broad and long-term objectives, whereas program goals should be quantifiable to establish a clear guide as to the success of the program. The following are two examples of goals used by major companies.
- Goal Example 1
A chemical company has adopted a corporate-wide goal of 5 percent waste reduction per year with waste specific goals for individual facilities (ref. 26). - Goal Example 2
An aerospace company has set the following waste reduction goals, using 1988 as a base year: 30 percent reduction by 1993, 50 percent reduction by 1995 and 80 percent reduction by 1997. In addition to general waste reduction goals, certain priority chemicals (e.g., chlorinated solvents) were identified for which specific reduction goals were established (ref. confidential contribution).
3.2.2.5 Pollution Prevention Planning
The task force should have the responsibility of developing a strategic pollution prevention plan and periodically updating the plan (e.g., annually). The plan should outline an approach to meeting program goals by: identifying specific action items; indicating a time frame for their planned completion; and indicating the responsible person or department. Early plan elements should focus on data collection and assessment and subsequent elements should focus on implementation. As the program progresses the plan will become more defined.
3.2.2.6 Assessment/Feasibility Analysis
The assessment/feasibility analysis is the engineering phase of the pollution prevention program (See Exhibit 3-5). It involves the collection of baseline data, data evaluation, identification of pollution prevention targets, and the identification, evaluation and selection of pollution prevention options. EPA has published assessment manuals (ref. 25, 26) that contain worksheets that can guide the user through these various steps. The problem with using the EPA manuals is the resultant mass of worksheets generated from performing an assessment and feasibility analysis for all but the smallest of operations. For an average size manufacturing plant, use of the EPA manual will generate 200 to 500 pages of forms. As an alternative methodology, firms can utilize the basic EPA approach and develop their own forms that are tailored to their production processes and treatment operations. Use of the manual in this manner is encouraged by EPA.2
3.3 GOOD OPERATING PRACTICES
Good operating practices, a subset of pollution prevention methods, are organizational and procedural activities that reduce the generation of waste. Generally, these are not equipment oriented methods of waste reduction, although the implementation of some good operating practices can result in significant capital expenditures when implemented plant-wide. Many of the good operating practices identified will provide product quality improvements and operating cost reductions in addition to reducing waste generation. Also, they will generally improve the working environment of a shop, including health and safety aspects.
3.3.1 Employee Awareness and Education
Employees are often the fundamental cause of the generation of waste and conversely, they are in the most advantageous position to employ pollution prevention and control. Without employee cooperation, even the best efforts of management will be ineffective or futile. As stated by one survey respondent: Operator input into pollution prevention is essential for their "buy-in." Further, most pollution prevention methods will fail unless the operators believe that the methods will work (PS 257).
Employee awareness and education begins with a clear company policy with regard to the environment and plans for pollution prevention and control (see Section 3.2). The policy must be conveyed to the employees and reinforced in various ways in order to create a sufficiently positive attitude toward meeting the company's environmental goals.
There are three stages to instilling a good pollution prevention attitude in employees and providing them with the needed knowledge to perform successfully. These are: prior to job assignment, during job training, and ongoing education throughout employment (ref. 303). This training should include the following elements:
- How, why and where waste is produced and how to minimize it (e.g., good rinsing practices).
- Preventive maintenance methods that reduce waste generation (e.g., tank/liner inspection and repair).
- Company rules for handling process chemicals and making process (tank) additions.
- Procedures for handling spills/leaks.
- How to operate pollution prevention and control technologies in their working area.
- Where to go for assistance with a non-routine problem.
- Capabilities and capacities of waste treatment processes.
- Environmental regulations and how they relate to the processes the employees operate.
- Why pollution prevention is important (cost, regulations, health and safety, improved working environment, improved environment).
- How related waste management operating costs (e.g., chemicals, water, waste treatment, hazardous waste) impact employee wages.
The advantages of establishing company rules and employee training will be reduced or eliminated unless the program has a method of measuring success and can deal with those who refuse to participate. Success should be quantified, whenever possible. This means companies should collect chemical use and waste generation data, maintain records and periodically evaluate the records. Data collection and record keeping are discussed in Section 3.3.2.
Bonuses, awards, plaques and other forms of recognition are often used to provide motivation, and to boost employee cooperation and participation. In some companies, meeting waste minimization goals is used as a measure for evaluating the job performance of managers and other employees (ref. 26).
Of the 318 plating shops responding to the Users Survey, 217 (or 68.2%) indicated that they conduct employee education for pollution prevention. The average success rating given by the respondents for this pollution prevention tool was 3.69 (see Exhibit 3-6.)
3.3.2 Chemical Tracking and Record Keeping
The major sources of pollution from plating operations are process chemicals. Process chemicals become pollution through both use and misuse, resulting in wastewater generation, spills/leaks, spent solutions, sludge and air emissions. To be fully effective, a pollution prevention and control program must track and record chemical purchases, chemical use, and waste generation. The following is a list of chemical and waste data that merit consideration for record keeping:
- Chemical purchases
- Chemical inventory
- Bath analyses (see Section 3.3.3)
- Process (tank) reformulations and chemical additions
- Partial tank discharges (i.e., decanting) and total tank discharges (i.e., batch dumps
- Water use per rinse tank or plating line (see Section 3.5.2.6)
- Total wastewater flow
- Wastewater treatment chemical use
- Spent process solution analyses
- Waste treatment sludge analyses
- Waste location
To increase the utility of the chemical use and waste generation data, corresponding production data should also be collected and recorded. These data can be used to identify decreases or increases in chemical use and waste generation that are due to production changes rather than operational practices.
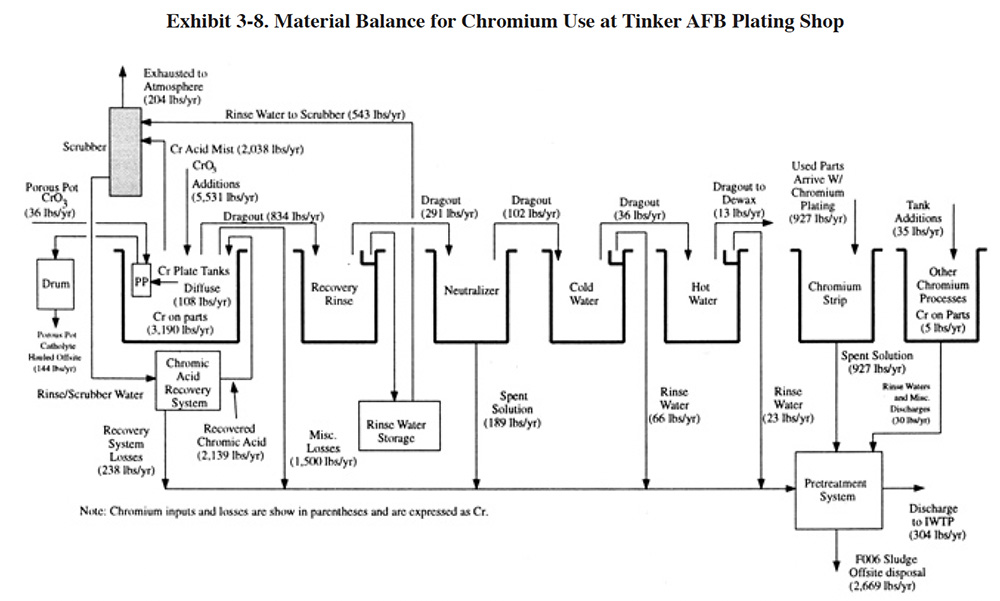
The chemical data can also be used to develop material balances for individual processes, a sequence of processes or an entire facility. A material balance, which is often shown as a block diagram, indicates the material inputs and outputs for the selected operation. Creating a material balance for a process such as chromium plating forces one to consider the various chemical inputs and losses such as chromic acid additions, emissions, drag-out, chromium plated onto parts, bath maintenance losses, etc. A material balance for chromium use at the Tinker AFB plating shop is shown in Exhibit 3-8.
Several questions in the Users Survey were related to chemical tracking and record keeping. These include questions 4, 6 and 7 of Exhibit 3-6 and question 8 of Exhibit 3-16. The response to question 4 showed that 207 shops (or 65.1 %) have instituted strict chemical inventory control. The response to questions 6 and 7 indicate that 393 shops (or 92.1 %) perform routine bath analysis and 273 shops (or 85.8%) maintain bath analyses and/or tank addition logs. The response to question 4 (Exhibit 3-16) indicates that 37 shops (or 11.6%) use water flow meters and/or accumulators to track fresh water use at each tank or plating line. Of these various pollution prevention options, the use of routine bath analyses and maintaining logs had the highest success ratings (4.37 and 4.35 respectively).
3.3.3 Chemical Purchasing, Storage, Usage, and Handling
Proper purchasing, storage, usage, and handling of chemicals increases the percentage of raw materials that reach their intended process without spills, leaks or other types of losses that could result in waste generation. Some basic guidelines for good operating practices include (ref. 303):
- Purchasing:
- Standardization of materials, i.e., using the minimum number of materials in all operations. Many times the decision to use one material over another is based on operator preference, rather than on a technical or economic requirement. Written specifications can improve purchasing and reduce waste (PS 257).
- Avoid overpurchase of materials.
- Avoid collecting free samples of process chemicals from vendors. Only accept amounts needed for testing purposes.
- Storage:
- Utilize a dedicated/protected storage area.
- Space containers in storage areas to facilitate inspection.
- Label all containers.
- Stack containers according to manufacturers' instructions to prevent cracking and tearing from improper weight distribution.
- Separate incompatible materials in storage such as cyanides and acids.
- Raise containers off the floor in the storage area to inhibit corrosion from "sweating" concrete.
- Handling/Use:
- Establish written procedures for process (tank) formulation and additions.
- Use specifically assigned personnel to formulate baths and make tank additions.
- Perform routine bath analyses and maintain bath analyses logs and tank formulation/addition logs.
- Use process baths to the maximum extent possible (do not employ a dump schedule).
- Remove zinc anodes from the baths when they are idle to prevent a buildup of metal in the baths.
- Implement multiple use of certain materials (e.g., soak cleaner is reused as an electrocleaner by PS 068).
- Implement statistical process control (SPC) to improve the efficiency of chemical use (PS 257).
Survey questions that relate to chemical usage, handling and storage include questions 4, 5, 6, 7, 8, 9, and 10 (Exhibit 3-6). The responses to several of these questions were previously discussed in Section 3.3.3. The response to question 5 indicated that 273 shops (or 85.8%) use specifically assigned personnel for chemical additions and the response to question 8 indicated that 229 shops (or 72.0%) have written procedures for bath make-up and chemical additions. These two pollution prevention options received particularly high average success ratings. The response to question 9 indicates that 234 shops (or 73.6%) use process baths to the maximum extent possible rather than employ a dump schedule and the response to question 10 indicates that 78 shops (or 24.5% of all shops or approximately one-half of shops performing cadmium and/or zinc plating) remove cadmium or zinc anodes from baths when they are idle. The latter practice prevents a buildup of dissolved metal in the bath, particularly with zinc plating.
3.3.4 Preventive Maintenance
In general, preventive maintenance is an important element in operating and maintaining a plating facility. With regard to pollution prevention, preventive maintenance can minimize chemical losses due to leaks and can reduce the potential for a catastrophic loss due to a tank failure. Specific areas where preventive maintenance can reduce pollution generation include:
- Periodic inspection of tanks and tank liners with replacement or repair of damaged or corroded units.
- Regular replacement of seals on chemical pumps and filter systems.
- Inspection and repair of racks and barrels, particularly focusing on loose coatings that can hide drag-out and nodules of plated metal that can dissolve in process tanks.
- Regularly checking tank bottoms for parts, fixtures and racks that have fallen and will corrode.
Of the 318 plating shops responding to the Users Survey, 185 (or 58.2%) indicated that they have established a preventive maintenance program for tanks, 207 (or 65.1%) indicated that they perform regular maintenance of racks and/or barrels and 250 (or 78.6%) indicated that they regularly retrieve fallen parts/racks from tanks (see questions 11, 12 and 16 in Exhibit 3-6). The success ratings for these three items fall within a narrow range (3.72 to 3.80).
3.3.5 Leak/Spill Prevention and Control
Chemical losses from leaks and spills can equal or out-weigh the losses due to routine production operations. If small leaks from pumps, filters or tanks go unnoticed or ignored over a long time period, the overall loss can be very significant. Catastrophic losses, such as a tank failure caused by corrosion, will cause more immediate results. Several methods for reducing the potential of chemical losses from these sources were identified from the literature and Users Survey. These include:
- Conduct preventive maintenance of pumps, fil-ters, tanks, etc., as discussed in Section 3.3.4.
- Employ a controlled method of adding make-up water to process tanks (do not permit use of unat-tended hoses).
- Install overflow alarms on all process tanks and especially on tanks that are heated and require regular evaporative replacement.
- Install double-walled tanks and for added protec-tion install a sight tube that will indicate if a leak of the inner wall has occurred. Two shops indicated use of this method for cyanide baths (PS 124, PS 133).3
- Implement company rules for tank additions and other chemical transfers.
- Construct secondary containment with segregation that would permit reuse of spilled material. For example, install berms around process tanks, external filter systems (PS 149) and pumps (PS 257).
- Install pH, ORP, moisture sensors, and/or conductivity sensors with an associated alarm system in bermed areas (PS 146, PS 155), sumps (PS 089, PS 165, PS 172), drain lines, or around treatment tanks (PS 036). Example: shops PS 089 and PS 165 installed moisture sensing alarms in sumps that under normal operation are dry. Of the 318 plating shops responding to the Users Survey, 50 (or 15.7%) indicated that they have installed over-flow alarms on process tanks and 47 (or 14.8%) have installed other spill or leak detection systems (see questions 13 and 14 in Exhibit 3-6).
3.4 DRAG-OUT REDUCTION
For the typical electroplating job shop, the drag-out of process solutions and the subsequent contamination of rinse waters are the major pollution control problems. This section explains the basic principles of drag-out theory and explores the function and applicability of the various drag-out minimization techniques in use today.
Because of the importance of drag-out and drag-out loss prevention, numerous questions in the Users Survey were related to this topic. The responses to these questions are discussed throughout the following subsections.
3.4.1 Drag-Out Reduction Principles
Electroplaters are well aware that drag-out varies considerably among the various parts plated at their shops. For example, the volume of drag-out in rack plating differs visibly from that in barrel plating. When a barrel emerges from a process tank, it usually carries with it over 10 times more solution than does a typical rack. In addition to the obvious effects of rack and barrel design and shape of parts, there are more subtle factors that affect the volume of drag-out. These parameters include viscosity and chemical concentration, surface tension, and temperature (ref. 1).
The viscosity of a plating process solution can be described as its resistance to flow or removal by another liquid (in this case, rinse water), caused by molecular attraction forces. The difference between high and low viscosity can be demonstrated with honey and water. A much thicker film will form on a knife dipped in honey than on one dipped in water. Honey, therefore, has the higher viscosity because of its cohesive and adhesive qualities. The same effect can be observed with plating solutions. If two identical surfaces are immersed in separate chromium baths with concentrations of 53 ounces per gallon (397 g/L) and 33 ounces per gallon (247 g/L), respectively, the lower concentration bath will produce 73 percent less volume of drag-out (ref. 1).
Surface tension is another physical phenomenon that has a significant effect in the plating shop. According to kinetic theory, molecules of a liquid attract each other. At the surface of a solution, such as a plating bath, the molecules are subjected to an unbalanced force because the molecules in the gaseous phase are so widely dispersed. As a result, the molecules at the surface are under tension and form a thin, skin-like layer that adjusts to create a minimum surface area. The property of surface tension causes liquid droplets to assume a spherical shape.
In the plating process, the volume of solution that clings to a workpiece surface depends partly on surface tension. The force of surface tension appears to be most significant at the bottom edge of the part as it passes through and leaves the process solution. This force and the resultant volume of drag-out appear to be greatly affected by the orientation of the part relative to the surface of the liquid (ref. 1).
The third factor that influences drag-out volume is the temperature of the process solution. Temperature is interrelated with viscosity and surface tension. As the temperature of a plating solution is increased, its viscosity, surface tension, and, therefore, drag-out volume are reduced. A possible exception is when a part is withdrawn too rapidly from a hot process solution, evaporation concentrates the film and impedes drainage. This problem, however, can be overcome by reducing withdrawal time and using a fog spray rinse on the parts as they emerge from the plating solution (ref. 306).
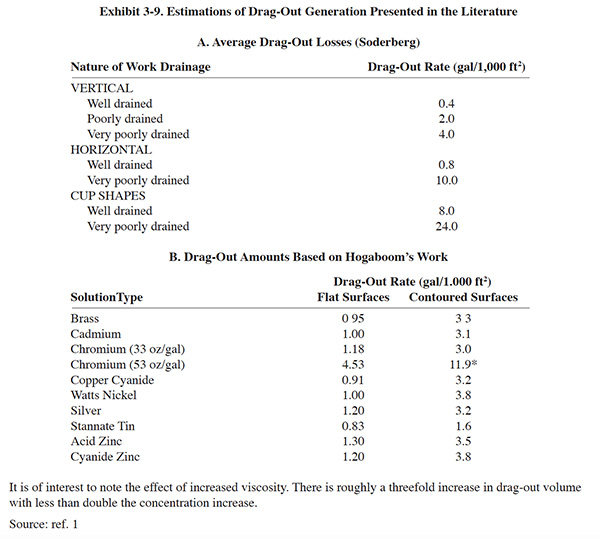
Estimations of drag-out have been presented in the literature (see Exhibit 3-9). However, these values should only be used for gross estimates. Actual measurements of drag-out are needed for accurate evaluations of pollution prevention options. Techniques for measuring drag-out are presented in various references (ref. 1, 20, 305). A simple and effective method for measuring drag-out is presented in Section 3.5.3.1.
3.4.2 Drag-out Reduction Techniques
Many devices and procedures are used successfully to reduce drag-out. These techniques usually are employed to alter viscosity, chemical concentration, surface tension, velocity of withdrawal, and temperature. Also used are drag-out tanks and similar equipment for capturing lost plating solution and for returning it to the bath.
Most drag-out reduction methods are inexpensive to implement and are repaid promptly through savings in plating and processing chemicals. An additional savings many times the cost of the changes is realized through decreased operating costs of a pollution control system. The reduced drag-out will decrease the need for treatment chemicals and, subsequently, the volume of sludge produced.
For some process solutions, return of drag-out may be impractical. In the case of processing baths which become steadily contaminated by use, the return of drag-out would simply increase the frequency of dumping (ref. 305). For example, PS 116 reported that drag-out recovery with electropolishing was "counterproductive."
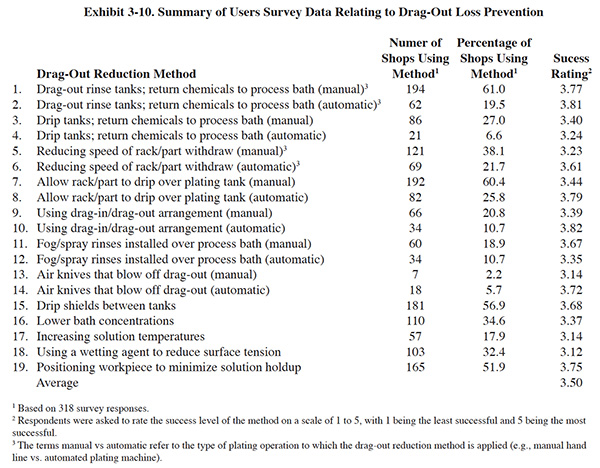
The following subsections provide further detail and discuss the results of the Users Survey with respect to dragout loss prevention. A summary of the Users Survey data relating to drag-out loss prevention is presented in Exhibit 3-10. As with the good operating practices, there is a high usage rate of these pollution prevention methods among respondents and all of the methods have received a success rating above the mid-point of the rating scale.
3.4.2.1 Minimizing Drag-Out Formation
The most obvious source of pollution in a metal finishing shop is the drag-out of various processing baths into subsequent rinses. The amount of pollutants contributed by drag-out is a function of factors such as the design of the racks or barrels carrying the parts to be plated, the shape of the parts, and plating procedures. As previously discussed, several interrelated parameters of the process solution, including the concentration of process chemicals, temperature, viscosity, and surface tension also impact pollution levels.
Many devices and procedures can be used successfully to reduce drag-out. These techniques are usually employed to alter those important and interrelated process solution parameters.
3.4.2.1.1 Controlling Plating Solutions
As a rule, as the chemical content of a solution is increased, its viscosity increases. Increased viscosity contributes not only to a large volume of drag-out, but also to a higher chemical concentration of drag-out. The consequent need for more rinse water creates additional pollution control problems. Plating baths can often be operated at significantly lower concentrations than those recommended by chemical manufacturers.
Of the 318 plating shops responding to the Users Survey, 110 (or 34.6%) indicated that they have lowered the concentration of a plating bath to reduce drag-out losses. The average success rating given by the respondents for this pollution prevention tool was 3.33 (see question 16 of Exhibit 3-10).
As mentioned in Section 3.4.1, temperature is interrelated with viscosity and surface tension. A total of 57 survey respondents (or 17.9%) indicated that they have tried increasing bath temperature to reduce viscosity and hence decrease drag-out formation. The average success rating for this method was 3.14 (see question 17 of Exhibit 3-10), which was the second to the lowest success rating of all pollution prevention options listed in the survey form.
For years wetting agents have been used in process solutions to aid in the plating process. These substances are used, for instance, in bright-nickel plating to promote disengagement of hydrogen bubbles at the cathode. They are also used as an aid to drag-out reduction. A wetting agent is a substance, usually a surfactant, that reduces the surface tension of a liquid, causing it to spread more readily on a solid surface. A typical plating bath solution has a surface tension close to that of pure water at room temperature or about 0.0050 lb/ft. The addition of very small amounts of surfactants can reduce surface tension considerably—to as little as 0.0017 to 0.0024 lb/ft (ref. 1, 39, 305). Further additions of the wetting agent will not lower the surface tension appreciably beyond this point (ref. 521).
Kushner (ref. 1) estimates that the use of wetting agents will reduce drag-out loss by as much as 50 percent, although no test data or other quantitative information are presented. He recommends the use of non-ionic wetting agents that are not harmed by electrolysis in the plating bath. Platers contemplating the use of a wetting agent for drag-out reduction should conduct experiments to determine their potential benefit before implementation. Also, platers should investigate the compatibility of a wetting agent with the bath chemistry before use. Some process baths (e.g., hard chromium) can only tolerate certain products (ref. 482).
In addition to reducing drag-out, wetting agents are used to reduce chromic acid mist formation during plating. The lower surface tension achieved with wetting agents reduces the effect that oxygen and hydrogen bubbles (generated at the tank's electrodes) have when they reach the surface of the bath (ref. 521).
Of the 318 plating shops responding to the Users Survey, 103 (or 32.4%) indicated that they use a wetting agent to reduce drag-out. The average success rating given by the respondents for this pollution prevention tool was 3.12 (lowest rated method).
One survey respondent that uses wetting agents made an interesting point, "I have no way of telling if wetting agents are effective." That shop rated this method at a success level of two. Shops that would like to quantify the effect of wetting agents on drag-out can perform simple drag-out tests like those described in the literature (ref. 1, 20, 305) using a sample of their standard bath and one to which a wetting agent has been added. Also, the surface tension of a bath can be measured with an inexpensive device called a stalagmometer.
Kushner further suggests keeping the concentration of all dissolved salts at the minimum needed for proper operation. To follow this recommendation, the plater should not permit substances to buildup in the plating bath, if it is possible to control and maintain them at the proper level. For example, cyanide baths are often permitted to buildup very high carbonate concentrations even though the concentration level could be controlled by treatment (e.g., carbonate freezing). Such a buildup could increase drag-out by as much as 50 percent (ref. 305).
3.4.2.1.2 Position on Rack
The metal finisher's primary consideration in the positioning of workpieces on a rack is proper exposure of the parts to the anodes for optimal coverage and uniform thickness of the electrodeposit. Drainage and rinsability are secondary, but very important considerations to pollution control. Also, damage to the workpiece surface can be caused by insufficient or inefficient rinsing, and succeeding process solutions can be contaminated by drag-in of unremoved chemicals from the previous solution (ref. 305).
Several rules apply to the position of work on plating racks for drag-out minimization. The basic principle, however, is that every object can be positioned in at least one way that will produce the minimum quantity of drag-out. This position could be determined by experiment, but unless a significant number of similar items are to be plated, it may be advisable to follow the suggestions of Kushner and Wallace (ref. 1, 305):
- Tilt all solid objects with plane or single-curved surfaces so that drainage is consolidated, that is, twist or turn the part so that the clinging fluid will flow together and off the part by the quickest route.
- If possible, avoid racking parts directly over one another to prevent lengthening the drainage path of the plating solution.
- Avoid table-like surfaces by tipping the part, but not at the expense of forming solution "pockets."
- Orient parts so that only a small surface area comes in contact with the liquid surface as it leaves the plating solution.
From the Users Survey, 165 (or 51.9%) shops indicated that they concern themselves with workpiece position in an effort to reduce drag-out formation. The average success rating given by the respondents for this pollution prevention method was 3.75 (see question 19 of Exhibit 3-10).
3.4.2.1.3 Workpiece Withdrawal
The velocity at which work is withdrawn from the process tank has a major effect on drag-out volume. The faster an item is pulled out of the tank, the thicker the drag-out layer will be because viscosity forces do not have a chance to operate and a much larger volume of liquid will cling to the surface (ref. 305). The effect is so dramatic that Kushner (ref. 1) suggests that most of the time allowed for withdrawing and draining the item should be used for withdrawal. An automatic machine that performs smooth, gradual withdrawal usually will drag out less solution per item racked than will manually operated equipment.
Questions 5 and 6 in Exhibit 3-10 indicated that reducing the speed of withdrawal is practiced by 69 respondents (or 21.7%) with automatic plating equipment and 121 respondents (or 38.1%) with manual lines. The success ratings were 3.61 and 3.23 respectively.
3.4.2.1.4 Design and Maintenance of Racks & Barrels
The transport of chemicals inside loose rack coatings from one process to another is not uncommon. For example, chromium may appear in rinse waters that are discharged into a plant's industrial sewer some distance from the chromium process tanks. The chromium often reaches these remote areas by way of loose rack coatings. Increased attention to rack maintenance not only will eliminate this potential problem but also will contribute to a welcomed reduction in the number of workpieces rejected because of poor contact (ref. 305).
Improving the design of racks, baskets, etc. to reduce the amount of solution they can trap will also reduce drag-out. For example, one shop reported great success by replacing old baskets with ones that had larger holes (PS 55). Many shops indicated that they have redesigned their racks to reduce pollution (e.g., PS 025, PS 058, PS 089, PS 159, PS 173, PS 192, PS 196, PS 229, PS 301, PS 316). Similarly, many barrel platers reduced drag-out by increasing the hole size of the barrels or making other design changes (e.g., PS 132, PS 214, PS 229).
As a group, the survey respondents indicated that regular rack/barrel maintenance was an important pollution prevention method. A total of 207 respondents (or 65.1%) indicated that they implement this method and the average success rating was 3.77 (see question 16 of Exhibit 3-6).
 |
 |
3.4.2.2 Direct Drag-Out Return
Commercially available equipment for the recovery of plating bath chemicals includes types that apply such principles as ion exchange, reverse osmosis, electrodialysis, and evaporation. These devices usually are applied to a single plating operation where they concentrate the salts in the rinse water, return them to the plating bath, and recycle the purified water to rinse tanks (ref. 305).
Although effective, these recovery technologies are capital intensive. Before the purchases of such equipment, metal finishing facilities usually implement simple methods of drag-out recovery that require much less capital and are simpler to operate. After using these methods and establishing new drag-out conditions, the plater can consider the applicability of additional recovery through commercially available units (ref. 305). This section describes methods that directly return the drag-out to the process tank. In the following section (Section 3.4.2.3) methods are described that recover the drag-out in tanks and then return it to the process bath.
3.4.2.2.1 Draining/Rinsing Over the Plating Tank
After a rack or barrel is removed from a process tank, the drag-out drains from the item and it returns directly to the bath as long as the item is held over the tank. This simple method of direct drag-out return can be maximized on a handline by installing a bar over the process line on which the operator can hang a rack or hook. On automatic machines, the unit can be programmed to increase dwell time above the process tank. For barrel operations, the barrel can be rotated over the process tank to help free the drag-out. Altmayer indicates that continuous barrel rotation is not always the best technique for freeing drag-out. He suggests that cup shaped parts should be rotated several times and then stopped and that free draining parts should not be rotated or rotated once and then stopped (ref. 482). As with many drag-out reduction methods, some experimentation will help to identify the optimal procedure.
The quality of a metal finishing process can be diminished if the drag-out is permitted to dry on the part. This can cause staining, peeling (PS 183), passivation, or it may prevent complete rinsing. To increase the drag-out removal rate over the process tank, rinsing with small amounts of water can be employed. The amount of water that can be used will depend on the water balance for a given process tank. The water balance is affected mostly by evaporation. Process solutions operated at temperatures greater than 120°F often have sufficient surface evaporation such that rinsing can be performed over the tank. However, using this method may reduce or eliminate the potential benefit from other drag-out recovery methods (e.g., use of a drag-out tank).
Rinsing over the tank can be performed by flood rinsing (e.g., hose), spray rinsing, or fog rinsing. The use of flood rinsing is not practical except for very high temperature baths with high drag-out rates. Spray rinsing uses less water than flood rinsing. With the proper selection of spray nozzles this can be a very efficient method of direct drag-out return. Nozzle selection should consider: flow rate, spray velocity, and spray pattern. Air-assisted sprays are also utilized, which are generally more efficient than plain water sprays. Sprays can be hand-held or mounted on the tank rim. For automatic plating machines, the sprays are controlled to operate only when the part exits the bath. For example, PS 193 employs an automatic rinse spray that actuates during vertical lift for a period of 7 seconds.
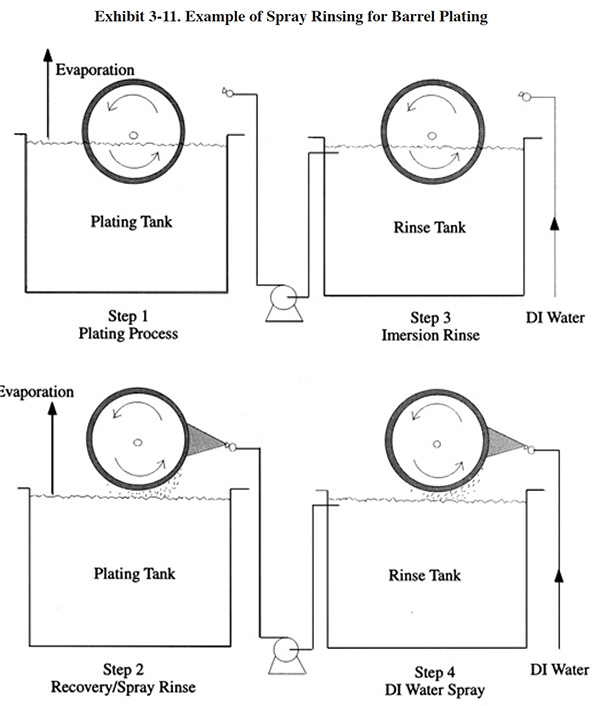
The use of spray rinsing is not limited to racked parts. It can also be applied to barrel lines. Exhibit 3-11 shows how a barrel plating spray rinse can be employed.
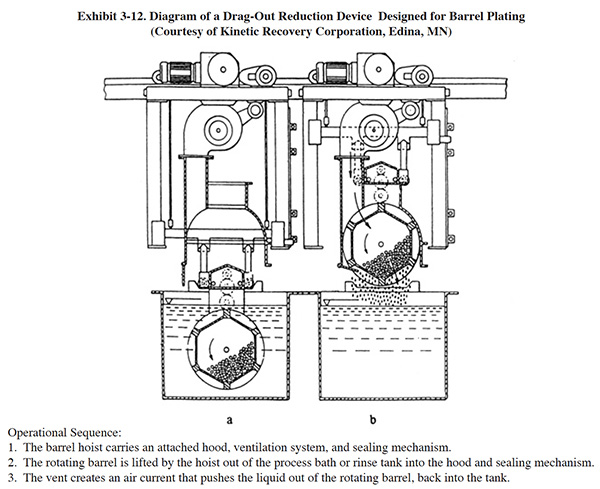
A novel barrel draining method is shown in Exhibit 3-12. This system, which can be retrofit to an existing barrel plating line, makes use of an air purge to push solution out of a barrel. Vendor tests showed that simple rotation removes 37% of the drag-out after 20 seconds (no further dripping) while the new air purge system removes 63% of the drag-out (tests performed with brass plating solu-tion).
Fog rinsing is used at exit stations of process tanks. A fine fog is sprayed on the work, diluting the drag-out film and causing a run-back into the process solution. Fog rins-ing is applied when process operating temperatures, high enough to produce a high evaporation rate, allow replacement water to be added to the process in this manner. Fog rinsing prevents dry-on patterns by cooling the workpieces, but it may preclude the use of a drag-out tank as a recovery option. For fog rinsing to be effective, work must be withdrawn from the process tank at a slow rate (ref. 305).
As with any pollution prevention method, fog/spray rinsing over the bath has potential drawbacks and problems. When used in conjunction with a ventilated tank, the spray may increase the pollutant loading to a scrubber or be directly vented to the atmosphere. Fog/spray rinsing may be messy as indicated by one respondent (PS 124), or worse, may cause splashing on nearby workers. One shop indicated that the nozzles required frequent maintenance (i.e., unplugging) and must be occasionally repositioned to point in the correct direction (PS 124).
These methods of drag-out reduction generally work best for automated operations. Manual operations are too dependent on the behavior of the operator. For example, operators "rush the dwell time" when draining over process tanks (PS 086) and "doesn't work due to tired platers ... also operators want to increase production and do not take the time to hold the racks to allow extra drainage time" (PS 210).
Survey questions that relate to draining and fog or spray rinsing over process baths include questions 7, 8, 11 and 12 of Exhibit 3-10. The response indicates that 192 (or 60.4%) and 82 (or 25.8%) of the survey respondents implement draining, respectively for manual or automatic plating operations. The average success ratings were 3.44 (manual) and 3.79 (automatic). Fog and spray rinsing over the process tank is less frequently used by the respondents. As shown in Exhibit 3-10, 50 (or 18.9%) respondents use this method with manual operations and 34 (or 10.7%) use this method with automatic operations. The average success ratings were 3.67 (manual) and 3.35 (automatic).
3.4.2.2.2 Other Methods of Direct Drag-Out Return
The following are miscellaneous methods of direct drag-out return that are not discussed elsewhere in the report.
A drain board or drip shield is a tilted surface placed between process and rinse tanks that catches the drips from racks or barrels as they are transferred between tanks, thus preventing the drag-out from falling to the floor. The solution on the drain board returns to its original tank by gravity flow. The drain surface can be plastic or metal. For acid solutions, the best materials are vinyl chloride, polypropylene, polyethylene, and Teflon®-lined steel. Stainless steel should be used for hot alkaline solutions. It is important that the drain surface be positioned at an angle that allows the plating solution to return to the bath (i.e., rather than the subsequent rinse) (ref. 305).
The use of drain boards or drip shields was a frequently used method of drag-out loss prevention by survey respondents. As indicated in question 15 of Exhibit 3-10, 181 survey respondents (or 56.9%) use this method. The average success rating was 3.68.
Another direct drag-out return method, the air knife, is a device that blows an intensive air stream at a part/rack as it exits the bath causing the drag-out to be blown off. The use of air knives is limited due to: (1) the potential to dislodge parts from racks; and (2) the drying effect of the air stream which may cause staining, passivation, etc.
Concerning the second limitation, Altmayer suggests that if the air is humidified to near saturation that drying will not occur (ref. 482). One respondent noted that the air supply must be oil-free (PS 257). One modern use of this device is with semi-aqueous cleaning systems, where the air knife is employed to minimize the quantity of solvent drag-out entering the water rinse system.
Air knives are not frequently used according to the survey respondents. Only 7 (or 2.2%) (manual) and 18 (or 5.7%) (automatic) of the shops surveyed employ this method of drag-out loss prevention. These shops rated the success level of air knives at 3.14 (manual) and 3.72 (automatic).
3.4.2.3 Drag-Out Recovery and Return
3.4.2.3.1 Drip Tank
A drip tank is an ordinary rinse tank that, instead of being filled with water, simply collects the drips from racked parts and barrels after plating and before rinsing. The drip tank is useful with work that involves continuous dripping over a period of time. Barrel plating, therefore, is a better candidate than rack plating for use of drip tanks. With barrel plating, the barrel should be rotated while it is suspended over the drip tank to ensure maximum drainage (see barrel rotation discussion in Section 3.4.2.2.1). When a sizable volume of solution has been collected in the drip tank, it can be returned to the plating bath. Because drag-out is not diluted with water when using a drip tank, this technique is especially applicable to lower temperature process solutions (ambient to 120°F).
Using a drip tank will restrict the use of an additional rinse tank, when floor space is limited. As will be discussed, an additional rinse tank, used as a drag-out tank or in a counterflow arrangement, is usually much more beneficial than a drip tank since a drip tank only recovers the drag-out that freely flows off the part/rack. The determining factors are the volume of drag-out, part configuration (i.e., drainability) and the evaporation rate in the process tank.
A total of 21 (or 6.6%) of the survey respondents use drip tanks with automated plating equipment and 86 (or 27.0%) with manual plating lines. The success ratings for drip tanks were 3.24 (manual) and 3.40 (automatic), which are lower than the success ratings of drag-out tanks.
3.4.2.3.2 Drag-Out Tank
The drag-out tank is a rinse tank that initially is filled with pure water. As the plating line is operated, the drag-out rinse tank remains stagnant and its chemical concentration increases as more work is processed. Air agitation is often used to aid the rinsing process because there is no water flow within the tank to cause turbulence. The presence of a wetting agent is also helpful, according to Kushner (ref. 1). After a period of operation, the solution in the drag-out tank can be used to replenish the losses to the plating bath. If sufficient evaporation has taken place, a portion of the drag-out tank solution can be added directly to the plating bath (e.g., using a transfer pump). Evaporation usually will be sufficient with baths, such as chromium and nickel plating solutions, that are operated at elevated temperatures. Low-temperature baths, such as cadmium or zinc plating solutions, have minimum surface evaporation and often their temperature cannot be significantly increased without degrading heat-sensitive additives. Reportedly, new additives, which are not as readily degraded by heat, have been developed for many of these plating baths. These additives might make operation of the plating bath possible at higher temperatures, facilitating drag-out recovery. Usually the value of the recovered chemicals is much greater than the increased energy cost associated with operating the bath at a higher temperature (ref. 305).
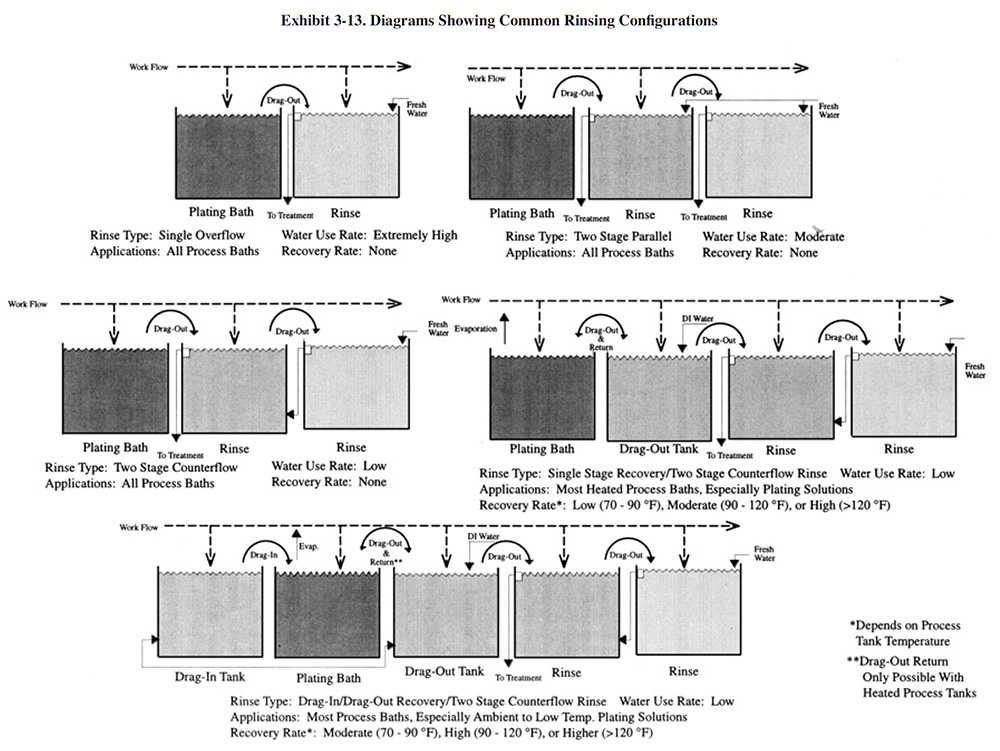
Diagrams showing the use of drag-out tanks and other rinsing configurations discussed in this section are shown in Exhibit 3-13. Drag-out tanks can be combined with counterflow rinsing to provide both chemical recovery and flow reduction.
Combinations of rinse configurations are discussed in Section 3.5.3.6.
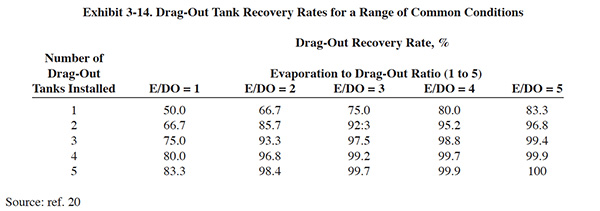
As a rough estimate, drag-out recovery, which is also referred to as recuperative rinsing (ref. 13, 14), will reduce drag-out losses by 50 percent or more. The efficiency of the drag-out tank arrangement can be increased significantly by adding a second drag-out tank. Use of a two-stage drag-out system usually reduces drag-out losses by 70 percent or more. In some cases, multiple drag-out tanks (e.g., three to five tanks) can be used to completely close the loop and return essentially 100 percent of drag-out (ref. 305).
The potential benefits (i.e., percent recovery) of drag-out rinse tanks can be estimated using either derived or empirical equations, a discussion of which follows. Actual results will depend on local factors (e.g., part configuration, operating practices, humidity).
The drag-out rate and evaporation rate are the key param-eters that determine what percentage of the drag-out can be recycled back to the process tank. Various mathemati-cal formula have been used to estimate the recovery rate (ref. 1, 39, 301). Exhibit 3-14 presents estimates for common conditions that can be used in lieu of the more complex equations.
Various methods can be employed for estimating or measuring drag-out, as discussed in Section 3.4.1. Evaporation rates of process tanks depend mostly on the operating temperature of the bath and to a lesser degree on the intensity of solution agitation. Where there is little evaporation in a process tank (e.g., baths operated below 110°F) there is little benefit from drag-out recovery tanks. PS 114 gave this method a rating of two for this reason. Various formulae and graphs are published for estimating evaporation (ref. 1, 39, 305). The following formulae are considered accurate, however, due to the relative ease of measuring evaporation rates, actual measurements should be used whenever possible.
Surface evaporation rates:
Still Tank: gal/hr/ft2 = e(0.03236T-7.20)
Agitated Tank: gal/hr/ft2 = e(0.02655T-5.95)
Where T = °F for process bath
Source: ref. 316
The transfer of solution between drag-out tanks and the plating tank and the addition of fresh make-up water to the system can be accomplished in several ways. Ryder (ref. 16) recommends that transfers to the plating tank be accomplished using a small pump (magnetic drive, sealless types) which is activated by a "dead-man" switch. The dead-man switch only permits solution transfer while the switch is depressed. If the operator leaves, the solution transfer automatically stops, which prevents catastrophic tank overflows. For adding make-up water, Ryder suggests using a level controlled valve (local float controlled) in the first rinse. When the solution level in the first rinse is lowered (i.e., after solution is transferred to the plating bath) the float switch is activated and fresh water is added to the final rinse. Ryder further suggests the use of a water control valve on the inlet water line for shut-off during non-operating periods.
With multiple rinse tank arrangements, the transfer of solution from rinse tank to rinse tank can be accomplished in the same manner as a flowing counterflow rinse system. These are discussed in Section 3.5.
The use of an automatic drag-out return system was described by Roy (ref. 4). In this system, chemical metering pumps were used to return drag-out from the rinse tank to the plating tank. The pumps were controlled by a level sensor in the plating tank. Roy also described a more complicated configuration where multiple drag-out tanks on different lines were connected to a "sump tank" using U-tubes. A level sensor in the sump tank controlled the water level in the drag-out tanks. As the drag-out return pumps drop the level in the sump tank, a level sensor turns on fresh water solenoids and the operating level is quickly restored.
 |
 |
It should be noted that although drag-out reduction can be a very effective means of pollution prevention, it may also present the plater with a new set of problems. In particular, by reducing drag-out, the plater reduces the purging of bath contaminants. The contaminants are contributed to process baths mainly by a breakdown of process chemicals and low concentration constituents in the fresh water (e.g., hardness). Other sources include: cross contamination due to transporting dripping racks over tanks, corrosion of bus bars, racks, anodes, tanks, etc., and airborne contaminants. Several shops identified contaminant buildup as a significant problem with drag-out reduction (PS 102, PS 124, PS 156). For example, PS 156 attempted to operate their shop on a near closed-loop basis. This facility, which now operates with an average flow of 16,800 gpd had reduced their flow, at one time, to 3,000 gpd. Their flow reduction efforts were partly discontinued after "contaminants entered the closed loop and caused plating problems." They also noted that their low volume discharge was contaminated with nickel and cyanide although these related processes were "closed loop." The presence of nickel and cyanide in their discharge may have resulted from cross contamination of baths caused by using the same racks for multiple lines. The presence of nickel and cyanide may also have been present when the flow rate was higher, but less noticeable due to dilution.
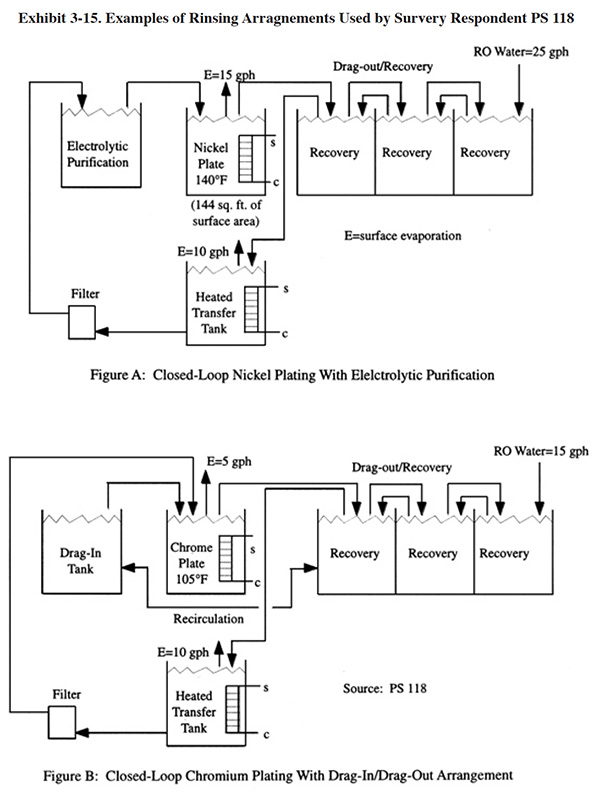
In some cases, drag-out reduction/recovery may result in serious degradation of the bath. To minimize the impact of contaminants, platers must do one or both of the following: (1) treat the raw rinse water prior to use with ion exchange and/or reverse osmosis technologies, (2) perform bath maintenance. Bath maintenance technologies are discussed in Section 4 rather than in this section. However, as a brief example of using bath maintenance with drag-out recovery, Exhibit 3-15 shows how one respondent has integrated electrolytic purification (dummying) into a closed-loop nickel rinsing configuration.
Another problem identified with drag-out tanks was the staining of parts by the drag-out rinse (PS 124 and PS 133). According to these shops, this was partly caused by drying of the solution on the part after drag-out rinsing.
The results of the Users Survey show that drag-out tanks are employed by 194 respondents (or 61.0% of all respondents) with manual plating operations and 62 (or 19.5% or all respondents) with automatic plating operations. The success ratings are 3.81 and 3.74, respectively.
3.4.2.3.3 Drag-In/Drag-Out Rinsing.
Drag-in/drag-out rinsing (also referred to as double-dipping) involves rinsing in the same solution before and after plating (see Exhibit 3-13). This can be achieved by using a single rinse tank or two hydraulically connected rinse tanks, usually located on opposite sides of the process tank. In the latter case, which is most applicable to automatic plating machines, the rinse water is recirculated between the two rinse tanks using a transfer pump to maintain equal concentrations of chemicals in the tanks. The advantage of a drag-in/drag-out arrangement is that plating chemicals rather than pure rinse water are transferred into the process tank by incoming racks or barrels. This increases the recovery efficiency of the recovery rinse.
The drag-in/drag-out system finds application with plating baths that have a low to moderate evaporation rate and especially with baths that tend to increase in volume (i.e., equivalent to a negative evaporation rate). This condition, referred to as "solution growth" is common to zinc cyanide baths (e.g., PS 051), where the volume of drag-in (water from the preceding rinse) can be greater than the sum of drag-out and evaporation. The recycle ratio, which determines recovery efficiency, is calculated as the volume of recycled rinse plus the volume of drag-out divided by the volume of drag-out. The recycle ratio, therefore, is greater with a drag-in/drag-out system than a common recovery tank. If the evaporation rate is low, the difference between the recycle ratios for common recovery and drag-in/drag-out systems is significant. When evaporation ratios are high, the difference is less. Generally, the use of a drag-in/drag-out arrangement will increase the recovery rate by 25 to 40 percent (ref. 305). The use of atmospheric evaporators for eliminating solution growth, an alternative to the drag-in/drag-out system, is discussed in Section 4.2.
As with drag-out tanks, the drag-in/drag-out arrangement can result in bath contaminant buildup, as indicated by PS 124, who rated the success of this method as a "1."
As with drag-out tanks, the drag-in/drag-out arrangement can result in bath contaminant buildup. Also, the use of a drag-in tank adds an extra labor step to the recovery rinsing process. PS 173 indicated that although this method worked, only a few of their employees will take the time to use it.
Exhibit 3-15 shows a drag-in/drag-out arrangement used by PS 118. Rinse water is circulated between the drag-in and first drag-out tank by pumping from one to the other and having a gravity return by raising the height of one tank. They are able to operate on a closed-loop basis except when plating certain assembled tubular pieces that have excessive drag-out. A porous pot is used to prevent excessive contaminant buildup.
A substantial number of survey respondents use drag-in/drag-out rinsing configurations. A total of 66 (or 20.8%) of the respondents indicated that they use this method with manual operations and 34 (or 10.7%) use it with automatic operations. The success ratings for drag-in/drag-out rinsing are 3.39 (manual) and 3.82 (automatic).
3.5 RINSE WATER REDUCTION
The results of the Users Survey show that many plating shops have made significant strides in reducing water use. Sixty-eight percent of the respondents indicated that they have reduced flows by implementing pollution prevention. For shops that were able to quantify their achievements, the average flow reduction was approximately 20,000 gpd (or about 30%). Some shops were reluctant to make estimates of flow reduction because process and production changes that have occurred during the same time period make such estimates difficult (includes at least 19 shops). The following shops achieved the most dramatic flow reductions (all of these shops reduced their flows by 50,000 gpd or more or by 90% or more) (shown are the original and current flow rates and the year of the original flow rate data):
- PS 022: from 140,000 gpd to 70,000 gpd (50%reduction since 1980)
- PS 036: from 52,700 gpd to 2,700 gpd (95%reduction since 1978)
- PS 059: from 90,000 gpd to 10,000 gpd (89%reduction since 1977)
- PS 118: from 232,630 gpd to 42,630 gpd (82%reduction since 1983)
- PS 139: from 127,000 gpd to 52,000 gpd (59%reduction since 1986)
- PS 150: from 400,000 gpd to 100,000 gpd (75%reduction since 1986)
- PS 172: from 150,000 gpd to 70,000 gpd (53%reduction since 1975)
- PS 184: from 121,000 gpd to 11,000 gpd (91%reduction since 1982)
- PS 207: from 68,000 gpd to 18,000 gpd (74%reduction since 1986)
- PS 213: from 130,000 gpd to 50,000 gpd (62%reduction since 1985)
- PS 250: from 91,000 to 11,000 gpd (88% reduc-tion, base year not given)
- PS 268: from 87,000 gpd to 17,000 gpd (80%reduction since 1987)
- PS 292: from 160,000 to 60,000 gpd (63% reduc-tion since 1985)
- PS 296: from 1,900,000 gpd to 1,700,000 gpd (11% reduction, base year not given)
- PS 298: from 160,000 gpd to 90,000 gpd (70%reduction since 1990)
- PS 309: from 25,000 gpd to 1,450 gpd (94%reduction since 1984)
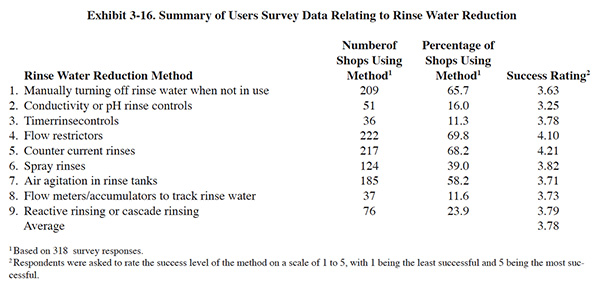
A summary of the Users Survey data relative to methods for reducing rinse water use is presented in Exhibit 3-16.
Although the plating industry as a whole has significantly reduced water use during the past 10 to 15 years, many plating operations can further reduce water use by improving the efficiency of their rinsing operations. The advantages of reducing water use include: (1) lowering operating costs by reducing the size of water bills; (2) reducing the quantity of treatment chemicals used (treatment chemical use is mostly dependent on the mass of contaminants, but a portion of treatment chemical use is related to hydraulic loading (see Section 7 which covers end-of-pipe treatment); (3) potentially improving the removal efficiency of waste treatment systems; and (4) reducing the needed size of future end-of-pipe treatment systems and certain types of recovery technologies. Central to the reduction of rinse water use is the required quality of water used in rinsing. Simply reducing the flow rate of water in a rinse system, without regard to water quality, may cause loss of plating quality or appearance or it may cause the contamination of the next tank in the plating sequence. Various rinse water quality criteria are presented in the literature. These are discussed in Section 3.5.3.1.
Various methods of water use reduction have been identified in the literature and throughout the Users Survey. These methods have been categorized into three groups: (1) optimizing the rinse tank design; (2) controlling the rate of rinse water use; and (3) using alternative rinsing configurations. The following is a discussion of each group.
3.5.1 Optimal Rinse Tank Design
The key objectives with regard to optimal rinse tank design are to attain fast removal of drag-out from the part and complete dispersion of the drag-out throughout the rinse tank. When these objectives are achieved, the time necessary for rinsing is reduced and the concentration of contaminants on the part when it leaves the rinse tank are minimized for a given rinse water flow rate. The following are rinse tank design elements that help to achieve fast drag-out removal and complete mixing. These methods can be combined to develop an optimal rinse tank design for a given workload. The optimal rinse tank design for different shaped parts, racks and barrels will usually result in the selection of a different combination of design elements. When parts with various configura-tions are rinsed in the same tanks, it may be necessary to compromise the design to provide adequate rinsing for all parts.
- Select the minimum size rinse tank in which the parts can be rinsed and use the same size for the entire plating line.
- Locate the water inlet and discharge points of the tank at opposite positions in the tank to avoid short-circuiting.
- Use a flow distributor/sprayer to feed the rinse water evenly.
- Use air agitation, mechanical mixing or other means of turbulence.
- Use spray rinsing for flat surfaced parts.
- Use ultrasonics, where applicable.
Air agitation was a relatively common element of rinse tank designs used by survey respondents. A total of 185 (or 58.2%) of the respondents reported its use. The average success rating was 3.71 (see Exhibit 3-16).
Spray rinsing is used by 124 (or 39.0%) of the survey respondents. The success rating for this method was 3.82.
3.5.2 Controlling the Flow Rate of Rinse Water Use
Regardless of the type of rinse tank arrangement employed (e.g., single overflow, counterflow), water use reduction can be achieved by coordinating water use and water use requirements. When these two factors are perfectly matched, the rinse water use for a given work load and tank arrangement is optimized. Four methods of coordinating water use and water requirements were identified during the Users Survey and literature search. Each of these methods is discussed in the following subsections. Some methods are applicable to a range of plating operations while others are more relevant to specific conditions (e.g., small manual operations, large automated machines). Some of the methods can be combined to optimize water use.
3.5.2.1 Flow Restrictors
Flow restrictors are inexpensive devices that are connected in-line with the tank's water inlet piping to regulate the flow of water through the pipe. They are typically an elastomer washer that flexes under pressure such that the higher the water pressure, the smaller the hole available for flow passage. Therefore, they maintain a relatively constant flow under variable water pressures. Flow restrictors are available in a wide range of sizes (0.1 gpm to more than 10 gpm). The smaller sized restrictors are most commonly used with multiple counterflow rinse tank arrangements and the larger ones are commonly used with single overflow rinses. Some restrictors aerate the water as it passes through, in a manner similar to a kitchen faucet (venturi effect).
Flow restrictors are applicable to nearly all rinse systems. A possible exception is a rinse tank equipped with a conductivity controller (see Section 3.5.2.3). With conductivity controllers, the instantaneous water flow rate is unimportant since the controller stops water flow based on the low conductivity set point of the controller and the conductivity of the water in the rinse tank. Therefore, restricting the flow will only reduce the time needed to dilute the rinse water to the conductivity set point and will not effect the total volume of water used.
Flow restrictors as a stand alone method of rinse water control are only effective with plating lines that have constant production rates, such as automatic plating machines. Even in such cases, to use water efficiently, the plater must have a means of stopping water flow during non-production periods. With variable production rates, flow restrictors alone will not provide the necessary coordination of rinse water need and use. One method for improving this coordination is to install a timer rinse control (see Section 3.5.2.4).
Generally, the size of a flow restrictor is selected to provide adequate rinsing for all parts. This means that the maximum rinse water flow requirement is the governing factor and that on the average, the flow will be higher than necessary for good rinsing. This fact is a sufficient reason for supplementing the control provided by a flow restrictor.
Flow restrictors are widely used by the respondents to the Users Survey. A total of 222 (or 69.8%) of the respondents employ this method of water use reduction. The average success level of this method is 4.10.
Only one survey respondent cited any problems with flow restrictors. That shop indicated that their platers usually remove the flow restrictors when they need to fill an empty rinse tank quickly and that the platers occasionally forget to replace them (PS 173).
3.5.2.2 Manual Control of Water Flow
Manual control of water flow simply refers to manually opening and closing water valves to adjust flow or to turn the water flow on or off. This method of control is obviously dependent on the operator and usually results in inconsistent water use. Several shops emphasized that this was a particular problem at their facility (PS 133, PS 176, PS 180, PS 265, and PS 276).
Combining manual control with flow restrictors reduces the variability of water flow; however, it does not address the problem of water use during idle production periods. Manual control can be improved by installing a main water valve for an entire plating line that stops water flow to all rinse tanks in that line.
A manual control method reported by one shop involved dumping and refilling all rinse tanks at one time, at the end of the day (PS 055). This shop is relatively small and has an average discharge of 5,500 gpd.
Of the 318 respondents, 209 (or 65.7%) use manual water control. The average success level for the respondents is 3.63.
3.5.2.3 Conductivity Controls
These units consist of three components: (1) probe or sensor located in the rinse tank that senses the conductivity of the rinse water; (2) transformer box that houses the solid state circuitry that controls the system; and (3) a solenoid valve that opens and closes in response to signals from the circuitry. In use, when drag-out is introduced to the rinse tank, the probe senses a rise in conductivity above a set-point which is picked up by the circuitry and the solenoid water valve is opened. The value remains open until the probe senses a drop in conductivity below a set-point. The set-points are operator-adjustable to permit use over a range of desired water qualities.
Conductivity rinse controls have been effectively used to reduce rinse water use (ref. 316). However, in some cases, they have been removed from service due to maintenance problems (ref. 21). The results of the Users Survey show a moderate level of usage for conductivity controllers (51 respondents or 16.0%) and the lowest success rating among rinse water reduction methods (3.25).
A report prepared for the military (ref. 379) listed three criticisms of conductivity controllers. First, the units are sometimes disabled or overridden by operators who object to the appearance of a controlled rinse, which may be less clear than a free-flowing rinse. Operators often override the units by placing the probe into a process tank or a bucket of process solution (i.e., causes solenoid to remain open). This problem can be controlled by shortening the length of the probe's cable or by running the cable through a PVC pipe (if using the later method, be certain the piping arrangement permits access to the probe for periodic cleaning). Second, the controllers do not sense non-ionic contaminants and rinse tanks may become contaminated with particulates such as dust. Third, the units require frequent preventive maintenance to remain operable. In particular, the probes become encrusted or fouled, especially in alkaline rinse waters. For example, one shop reported that they are "difficult to keep clean" (PS 086). Another shop indicated that they are a high maintenance item and susceptible to fouling (PS 114). Also, probes sometimes become entangled with plating racks and are damaged or disconnected.
One shop reported that they tried conductivity controllers and found them to cause high water use (PS 069). Presumably, the range of settings available on their units did not satisfy their rinse criteria. The shop discontinued the use of these devices and reverted to manual control and flow restrictors. A different problem was reported by another shop that indicated their controllers were not triggered by acid at a concentration that obviously impacted rinse quality (PS 124).
Altmayer suggests that conductivity controls using probes to measure the resistance (conductance) between two wires are very troublesome to operate, but that the controllers using inductive loop type probes, which are less susceptible to fouling, can be very successful. Altmayer also related to the experience of PS 069 and PS 124 (see above paragraph), saying that controllers must be specified to control within a certain range of conductivity and that choosing this range is the hardest part of the design. He stated that this problem is mainly caused by the lack of information and data available. Most guidance is based on total dissolved solids (TDS) as opposed to metal ion content, which is more familiar to the plater (ref. 482).
3.5.2.4 Solenoid Valve on Automated Plating Machines
One large job shop reported that they have installed solenoid valves on the water lines feeding each of their automated plating machines (i.e., semi-automated return-type). The valves automatically close when power to the plating machine is turned off.
3.5.2.5 Timer Rinse Controls
Timer rinse controls consist of a push-button switch and timer mechanism and a solenoid valve. These units operate in a manner similar to conductivity controllers; however, rather than regulating rinse water flow on the basis of rinse tank water quality, the timer controls simply turn water on and off based on a preset time period.
In operation, a plater lowers parts into the rinse tank and pushes a button (alternatively, a momentary switch could be used that is activated by lowering a rack or barrel). The button or switch activates a timer and opens the solenoid valve for a preset time period. After that time period has expired the solenoid valve automatically closes.
The timer setting is selected through trial and error. It is best to select a time period that provides consistently clean rinse water, without excessive waste. Once set, the time period is not changed unless the general trend of production changes.
Fewer of the Users Survey respondents have employed timer rinse controls than conductivity controllers. The number of respondents using timer rinse controls was 36 (or 11.3%). The average success rating was 3.78, which is significantly higher than for conductivity controllers. Several shops indicate that they have employed both. One such shop rated their success with the timer rinse control as "5", while rating their success with conductivity controllers as "1".
3.5.2.6 Flow Meters and Accumulators
These devices by themselves do not reduce water use. However, they make the metal finisher aware of water use rates and are useful in identifying excessive water use.
Flow meters and accumulators are most useful when installed on fresh water lines feeding individual rinse tanks or, at a minimum, on pipes feeding individual plating lines. Meter readings taken over an extended time period will show trends in water use. Using these data, shop management can identify specific locations where excessive water use occurs and can correct the problem before longterm wastage has resulted.
One shop that installed flow accumulators indicated that they were useful for specific studies, but in general were found to be a rather expensive way to generate usage numbers of "questionable validity" (PS 124).
3.5.3 Alternative Rinsing Configurations
3.5.3.1 Generating Rinsing Data
To evaluate rinsing alternatives effectively, the plater needs drag-out and water use data, rinse quality criteria and equations that utilize these data and criteria. Of these items, the drag-out data are the most difficult and expensive to obtain. The high cost is due to a need for expensive analytical work. A well proven method of generating drag-out data, that is easy and inexpensive to apply, is discussed in this subsection. This method, which utilizes conductivity measurements, was originally described by Mohler (ref. 2).
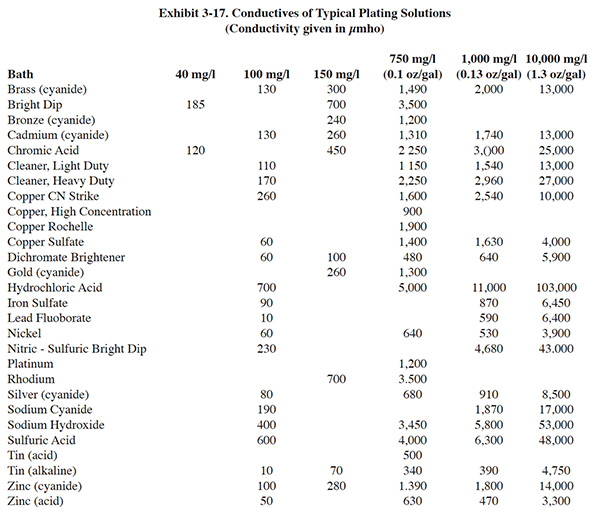 |
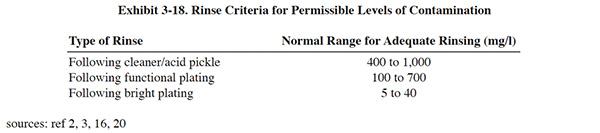 |
In order to utilize this methodology, a conductivity meter is required. Using a conductivity meter greatly reduces the analytical costs of generating rinsing data. In a matter of hours a plater can generate a quantity of data equal to that generated by days of laboratory work. Also, unlike using laboratory analytical methods, with the conductivity meter approach there is almost no lag time associated between the taking of samples and generating of results. Most plating shops have combination pH/conductivity meters in their shops that can be used for this purpose. Alternatively, a portable unit of sufficient quality can be purchased for under $100. Exhibits 3-17 and 3-18 present the conductivity values and rinsing criteria used in the following method.
1. Use conductivity measurements to determine the present concentration of a plating solution in a rinse tank (example: sulfuric acid pickle).
Measure the conductivity of your tap water (or DI water if used):
a = 100 µmho (micromhos)Measure the conductivity of the rinse water. If a multiple rinse tank arrangement is present (e.g., counterflow), make the conductivity measurement in the last rinse (i.e., least contaminated).
b = 5,500 µmhoIn a container, add one ml of the pickle solution to one liter of rinse water and measure the conductivity:
c = 6,250 µmhoThe increase in conductivity for one ml of pickle solution per one liter of rinse water is:
c - b = 6,250 - 5,500 = 750The concentration of pickle solution in the rinse water is:
e = (b - a)/(c - b) = 5,400/750 = 7.2 ml/lThe equivalent sulfuric acid in the rinse is (see Exhibit 3-17, 6,300 µmho = 1,000 mg/l):
1,000 (c - a)/6,300 = 6,150,000/6,300
f = 976 mg/l equivalent H2SO4Compare this concentration to the criteria in Exhibit 3-18 to determine if the proper rinse flow rate is being used. If necessary, adjust the rinse flow and repeat the measurements until the rinse criteria is met.
2. Use conductivity measurements to determine the drag-out rate.
First determine the rinse water flow rate. Record the number of racks processed per hour. Note the valve setting, turn off the flow, bail out six or more inches of water, set the flow and record the rate of rise of the water in inches per minute. From the number of racks processed and the rate of rise of the water calculate the flow as liters per rack (alternatively flow can be expressed in l/ft2 of wetted area, l/barrel, or another relevant unit of measure):
g = 8.0 l/rackSecond, measure the drag-in per rack. Turn off the flow, agitate the rinse, measure the conductivity, process a number of racks of work through the rinse, agitate the rinse, and measure the conductivity again. From the µmohs increase per rack calculate the drag-in ml/rack:
h = 50 ml/rack3. Use the equation presented in Section 3.5.3.2 to evaluate the effect of adding additional rinse tanks.
3.5.3.2 Counterflow Rinsing
Electroplaters have long reduced water use by employing several rinse tanks connected in series. Fresh water flows into the rinse tank located farthest from the process tank and overflows, in turn, to the rinse tanks closer to the process tank (see Exhibit 3-13). This technique is termed counterflow (or countercurrent) rinsing because the work piece and the rinse water move in opposite directions. Over time, the first rinse becomes contaminated with drag-out and reaches a stable concentration which is lower than the process solution. The second rinse stabilizes at an even lower concentration which enables less rinse water to be used then if only one rinse tank were in place. The more counterflow rinse tanks (three-stage, four-stage, etc.), the lower the rinse rate needed for adequate removal of the process solution.
Counterflow rinsing systems are not without drawbacks. The negative aspects of counterflow rinsing include: (1) cost of additional rinse tanks; (2) loss of valuable production space; and (3) an increase in production time/labor.
The rinse rate needed for adequate cleaning is governed by an exponential equation that depends on the concentration of plating chemicals in the drag-out, the concentration of plating chemicals that can be tolerated in the final rinse tank before poor plating results, and the number of counterflow rinse tanks. The mathematical rinsing models are based on complete rinsing (i.e., removal of all drag-out from the part/fixture) and complete mixing (i.e., homogeneous rinse water). These conditions are not achieved or even approached unless there is sufficient residence time and agitation in the rinse tank. More typically, each added rinse stage reduces rinse water use by 50 percent.
The most commonly applied counterflow rinsing model follows:
Rc = (Ct/Cr)1/n
where,
Rc = rinsing ratio
Ct = concentration in the preceding tank
Cr = required concentration in the last rinse tank n = number of rinse tanks
This model does not predict required rinse rates accu-rately when the value of Rc falls below 10. Also, com-plete rinsing will not be achieved unless there is sufficient residence time and agitation in the rinse tank.
The following example demonstrates the use of the counterflow rinsing equation. A typical Watts nickel plating solution contains 270,000 mg/l of total dissolved solids, and the selected final rinse concentration is 37 mg/l of dissolved solids. The ratio of Ct/Cr is 7,300 and approximately 7,300 gallons of rinse water are required for each gallon of process solution drag-in with a single-tank rinse system. By installing a two-stage rinse system, water requirements are reduced to 86 gallons of water per gallon of process solution drag-in (assumes 100% rinsing efficiency). The same degree of dilution is obtained in the final rinse, and the rinse water consumption is reduced by 99 percent. The mass flow of pollutants exiting the rinse system remains constant, however, the pollutants are much more concentrated with a two-stage rinse system than with a single-tank rinse system.
From the User Survey results, 217 respondents (or 68.2%) employ counterflow rinsing. These respondents gave this method of water use reduction a success rating of 4.21, the highest for any water use reduction method.
3.5.3.3 Cascade, Reactive, and Dual Purpose Rinsing
Cascade rinsing refers to the practice of reusing rinse water multiple times in different rinse tanks for succeeding less critical rinsing. Reactive rinsing is similar, but it refers to cases where a chemical reaction takes place as a result of using the rinse water for multiple purposes. An example is reusing the rinse water following acid cleaning as rinse water following alkaline cleaning. In this case, the acid rinse water helps to remove the viscous alkaline film remaining on a part after alkaline cleaning.
Dual purpose rinsing refers to the practice of using the same rinse tank for rinsing following more than one process tank. It provides essentially the same results as cascade and reactive rinsing but uses a fewer number of rinse tanks. Often, the employment of dual purpose rinsing means transporting a dripping rack/part over a considerable distance. This can result in dripping onto floors and/or the accidental contamination of other tanks. An exhaustive evaluation of dual purpose rinsing is presented by Mohler (ref. 3). Mohler presents methods and guidelines for ascertaining the accumulated concentration of chemicals in counterflow, dual-purpose rinses in order to determine the feasibility and economics of this technique.
Typically, cascade and reactive rinsing are used for automatic plating machines whereas dual purpose rinsing is used for manual operations.
Use of any of these methods must closely consider the combined chemistry in the rinse tank to prevent undesirable
reactions that may impact worker safety (e.g., hydrogen cyanide formation) or work quality (e.g., precipitation of
solids).
Reactive or cascade rinsing is used by 76 (or 23.9%) of the survey respondents to reduce water usage. These
respondents gave this method an average success rating of 3.79.
3.5.3.4 Chemical Rinsing
The technique of chemical rinsing has been used by the metal finishing industry for many years. One of its earliest applications was to eliminate staining from chromium solution, which is notoriously difficult to rinse. By simply making the first rinse after chromium plate a stagnant rinse containing sodium bisulfite, the drag-in of hexavalent chromium was converted to trivalent chromium. The rinsability of the workpiece in the second rinse was improved considerably by changing the chemical nature of the film on the workpiece in the stagnant rinse and by reducing film concentrations before attempting to rinse by diffusion. The same principles are frequently employed in "neutralizing" dips.
The application of chemical rinsing to plant effluent treatment, known in the industry as integrated waste treatment, has been described by Lancy and Pinner (ref. 305). Aside from the environmental benefits, this type of rinsing also prevents the majority of heavy metal solids formed in the chemical rinse from reaching the succeeding water rinses by removing these materials in an external settling vessel. Removal of these solids is accomplished by flowing the chemical rinse solution to a treatment reservoir. The overflow from the reservoir is pumped back to the rinse tanks, forming a complete closed-loop system. Integrated treatment gained some popularity in the 1970's, but is believed to be in little use today, mostly due to high maintenance requirements.
3.5.3.5 Spray Rinsing
Spray rinsing is employed in various manners to reduce drag-out losses and rinse water use. Spray rinsing over process tanks (Section 3.4.2.2) provides direct recovery of drag-out. Spray rinse tanks can be used as drag-out tanks, single rinses, or multiple rinses.
A common use of spray rinsing is to substitute a spray rinse tank for an overflow rinse tank. Depending on the part configuration, spray rinsing generally uses from one-eighth to one-fourth the amount of water that would be used for equivalent dip rinsing (ref. 305). Spray rinsing is most effective for flat-surfaced parts and is less effective with recessed and hidden surfaces.
Although less commonly used, a spray rinse can substitute for a drag-out tank. Several shops indicated that they consider this a very successful pollution prevention measure (e.g., PS 177, PS 242, PS 275). Using this method, one shop has reduced their discharge from 15,000 gpd to an average flow of 800 gpd (PS 242). PS 275 employs a fog spray rather than a common spray rinse (success rating of "4").
Combined spray and dip rinse tank designs are employed where the bottom portion of a rinse tank acts as a dip tank and the upper portion a spray rinse. A weir is located at approximately the middle of the tank which maintains the solution level in the tank. In operation, the rack is lowered into the dip rinse, raised above the solution level, and sprayed with fresh water. This combination rinse can be nearly as effective as a counterflow rinse, but takes up the floor space of one tank.
The design of spray rinses must consider the size and shape of the part. Spray nozzles are available in many sizes and spray patterns, and should be selected appropriately. Usually, the pressure in the waterline is sufficient to operate an effective spray rinse, however, higher spray velocities can be obtained by pumping.
A special application of the spray rinse is a patented unit (ref. 6) that contains five to seven progressively cleaner rinse solutions in separate compartments. The solutions are successively pumped (up to 20 gpm) to a spray rinse tank and drain back to the unit. During each cycle, only the water use in the first spray is discarded or processed for recovery. The subsequent sprays are collected for reuse in the following cycles. The advantage of this unit is that it provides the effect of multiple counterflow rinsing with use of a single rinse tank. The floor space requirement of the unit is 7.5 square feet (five stage rinse unit) or 11.0 square feet (seven stage rinse unit).
Although it is not widely used, spray rinsing is applicable to barrel plating operations as previously shown in Exhibit 3-11.
One shop reported that their platers are mistrustful of the efficiency of spray rinses. Whenever plating quality problems arise, the platers target the spray nozzles as the cause (PS 176). Another shop complained that spray rinses often clog and must be cleaned or replaced (PS 230).
The Users Survey showed a moderate to high usage rate of spray rinsing. Most frequently it was used as a water use reduction method and to a lesser degree for drag-out loss prevention (fog or spray rinse over process tank). As a water use reduction method 124 (or 39.0%) of the shops employed spray rinsing. These respondents gave spray rinsing an average success rating of 3.82.
3.5.3.6 Combined Drag-Out Loss/Rinse Water Reduction Rinsing Arrangements
Many plating shops combine drag-out tanks and overflow rinsing in the same rinse systems (see Exhibit 3-13). For example, a four rinse system could consist of two drag-out tanks connected in series and two free-flowing rinses connected in series (counterflow). Alternatively, the system could consist of three drag-out tanks in series and a single overflow rinse or a drag-in/drag-out arrangement and two counterflow rinses. Various rinsing configurations can also be combined with chemical recovery technologies, as discussed in Section 3. The optimal rinse configuration will depend on numerous factors including: (1) the evaporation rate in the plating tank, (2) the drag-out rate, (3) the rinse water quality requirement (final rinse), (4) process chemical costs, (5) alternative technology recovery costs, (6) water costs, and (7) wastewater treatment/sludge disposal costs.
In general, when more of the available rinse tanks are used as drag-out tanks, the process chemical and wastewater treatment operating costs are lowered and water use costs are increased. The reverse is true when more tanks are used for counterflow rinsing than for drag-out recovery tanks.
The optimal configuration can be determined through mathematical means which must be supported by data collection (i.e., drag-out and evaporation measurements, production rates, etc.) for producing accurate results. Examples of such analyses are presented in ref. 305 for chromium and nickel plating. As an alternative to using the rinsing equations to perform the calculations, a modeling program can be employed. A commercially available software program (ref. 317) permits an analysis considering up to five rinse stations and the use of supplemental evaporative recovery. This program permits the user to add recovery rinses, change tank volumes, experiment with process chemistries, add evaporators, and change workload to find the combination that makes the most environmental and economic sense (ref. 398).
3.6 REUSE OF TREATED WASTEWATER
Some shops responding to the Users Survey indicated that they reuse treated wastewater in their rinse tanks. Most of the reported reuse of treated wastewater is practiced at shops with conventional treatment (i.e., hydroxide precipitation) (PS 054, PS 091, PS 109, PS 123, PS 128, PS 199). This reuse is generally done in non-critical rinses (e.g., PS 199 reuses effluent in rinses following alkaline soak cleaners and acid dips). Some shops filter the treated wastewater before reusing it (e.g., PS 123 pumps it through a sand filter). Two shops reused the filtrate from a filter press as rinse water (PS 109 and PS 168).
Those contemplating the reuse of chemically treated water should be cautioned that a hydroxide precipitation process generates an effluent that is high in dissolved solids (e.g., sodium) that will contaminate subsequent process tanks. More extensive treatment is needed to produce a suitable quality of water for most rinsing needs. For example, two shops responding to the Users Survey reuse treated water after: (1) hydroxide precipitation/ion exchange (PS 068) and (2) hydroxide precipitation/ultrafiltration/reverse osmosis (PS 233). Ion exchange is generally not a good choice of technology for recycling treated wastewater. The treated wastewater will contain a high concentration of anions that must be removed to produce a reasonable water quality. Applications of ion exchange recycling are discussed in Sections 4.4 and 7.5.2. Membrane filtration, a viable option for effluent recycling, is discussed in Section 7.5.3.
3.7 CLOSED-LOOP PROCESSING AND ZERO DISCHARGE
Closed-loop processing and zero discharge are two terms that are often used by platers, vendors, consultants and regulators (ref. 206, 223, 229, 258, 294, 397, 469, and 470). Various definitions are used for these terms, most of which recognize that 100 percent recovery/reuse of all materials (process chemicals, other chemicals, water, sludge, etc.) is not practical, economically feasible nor efficient from an energy standpoint.4 More realistically, all metal finishing shops as well as individual metal finishing processes generate some form of residuals. The residuals are typically in one or more of four common forms: wastewater, spent process solutions, sludge, or air emissions. Often, some recovery/reuse can be implemented, but with every technology scheme or configuration there is some residual generated. Often there is a trade-off between the quantity and characteristics of two or more of the four common residuals. As a simple example, closed-loop rinsing after chromium plating will result in a build-up of contaminants in the bath. The rinse water discharge can be eliminated, but the bath will have to be either discarded or "purified." If the bath is purified, the purification process (e.g., porous pot, membrane electrolysis, or ion exchange) will result in a residual that must be properly discarded.
Of the 318 respondents to the Users Survey, 24 (or 7.5%) indicated that they have achieved zero discharge (these shops can be identified from Exhibit 2-8). Many other shops indicated that they are working towards this goal. Of the shops that have achieved zero discharge, 58% are primarily hard chrome platers. The hard chrome process is one the easiest to operate without a wastewater discharge because of the high ratio of evaporation to drag-out (i.e., permits use of recovery rinsing). Also, as indicated in Section 4.2.5, the respondents that have achieved zero discharge are generally smaller shops, which tend to be less complex and less automated. As a result, these shops generally have simple, manual processes that if given sufficient control can be operated without a wastewater discharge. The means implemented by these shops to achieve zero discharge is most frequently recovery rinsing and atmospheric evaporation. However, eight respondents have implemented advanced technology schemes in order to achieve zero discharge. The technologies implemented by these shops include vacuum evaporation, ion exchange, and membrane filtration. These systems are discussed in Section 7.
There are various economic benefits of operating closed-loop processes or a zero discharge shop, including: lower water and sewer charges, less effluent monitoring and paperwork, and reduced chance of compliance excursions/fines. Some firms are driven to zero discharge by specific regulatory conditions rather than economics, such as discharge permits with low numerical or mass loadings, TDS limits or aquatictoxicity-based standards and low in-stream dilution factors. Furthermore, some facilities are practically isolated from sewers or streams (ref. 516). A negative aspect of zero discharge is the loss of flexibility that is provided by a wastewater treatment system/discharge. This loss can translate into higher costs for hauling spent process solutions to disposal sites, for example, if unexpected process solution contamination occurs. Also, one source indicates that closed-loop systems may pose regulatory conundrums, in that without a wastewater discharge permit, firms lose the RCRA treatment exemption and become subject to Part B permits (ref. 223).5 That source suggests that firms intent on eliminating wastewater discharge should negotiate a "closed-loop" Clean Water Act permit (i.e., NPDES or POTW) with the regulatory authority. Legal requirements and options for companies that wish to operate zero discharge facilities are discussed in the literature (ref. 516).
Zero discharge is generally achieved in stages: (1) prepare a plan (e.g., as part of a pollution prevention program, see Section 3.2); (2) implement good operating practices (Section 3.3); (3) minimize drag-out which causes wastewater generation (Section 3.4); (4) modify rinsing practices to reduce/eliminate flows to treatment (Section 3.5); (5) implement bath maintenance6 and chemical recovery (Sections 4 and 5); (6) continuously reassess flow rates, process chemical/contaminant concentrations in recovered streams, costs, and benefits. Additional suggestions for zero discharge programs can be found in ref. 223.
3.8 OTHER RINSING INFORMATION
This subsection contains information on methods applied for rinse water use reduction that are not discussed in detail elsewhere in the report.
One shop indicated that they use in-tank filtration in large rinse tanks (PS 228) and another shop indicated that they use external filtration for some rinses (PS 275). The filtration technology, which is more frequently applied to process baths than to rinse tanks, removes particulate matter from solutions. The source of particulates for these two shops was not indicated on their survey forms. However, it is known that suspended solids in rinses can be caused by precipitation (e.g., mixing of alkaline cleaner drag-out and metal-bearing drag-out) or airborne material.
Although it is not widely applied to rinsing, the use of ultrasonics can improve its effectiveness. Ultrasonics loosen soil particles that are not completely removed during the cleaning step. Although one would expect the use of ultrasonics to be limited to small rinse tanks and critical operations due to its high capital costs, one shop reported that it uses ultrasonics in a large rinse tank (12' x 30" x 40" deep) following electropolish (PS 022). Another respondent suggests that ultrasonics be used in rinse tanks whenever feasible (PS 068).
Most existing process lines suffer from a lack of rinsing. When use of additional counterflow rinse tanks is sug-gested, the most common complaint is that there is no space, thus rinsing suffers and flow rates remain high. To gain additional tankage, some shops partition large rinse tanks into two or more smaller sections (ref. 9).
3.9 SUMMARY OF GENERAL WASTE REDUC-TION PRACTICES
Summary tables have been prepared based on the informa-tion and data from the Users Survey and literature search and the discussion presented in this section. Exhibit 3-19 presents a summary of improved operating practices that reduce waste generation. Exhibit 3-20 presents a summary of drag-out reduction methods and Exhibit 3-21 presents a summary of rinse water use reduction methods.
Section 3 Footnotes
1 Section 4 of the Users Survey addressed pollution prevention methods and techniques. The
platers were requested to rank, on a scale of one to five, the success of each method or technique that they used (1
= unsuccessful and 5 = highly successful).
2 Additional information regarding pollution prevention programs, including examples of assessments, is
available from EPA (ref. 25, 302).
3 One of these shops fabricated doubled walled tanks themselves and installed sight glasses (PS 133).
During follow-up conversation, this shop warned that brass sight glasses, which are the most commonly used, are not
applicable to cyanide containing tanks. They suggest using either stainless steel or PVC (PVC sight glass available
from U.S. Plastic Corporation, Lima, OH). PS 133 also suggests placing the sight glass in a protected, front corner
of the tank (i.e., should be readily visible, but protected from damage).
4 The most frequently accepted definitions of the terms closed-loop processing and zero discharge refer to
the elimination of a Clean Water Act regu-lated wastewater discharge rather than the complete elimination of wastes
of all types; usually associated with partial recovery of plating chemicals. 5 The Resource Conservation
and Recovery Act requires firms to obtain a permit for the operation of hazardous waste treatment processes. Such
systems are exempt from permitting if they treat wastewaters that are discharged under the Clean Water Act.